Exercise summary: Install Prometheus and Grafana, configure IDM to provide monitoring statistics and experiment with the sample dashboard available on backstage.
Prometheus is a third-party tool used for gathering and processing monitoring data.
IDM 6.0 has implemented a metrics endpoint which Prometheus can use to gather information about your IDM installation. For more information about installing and running Prometheus, see the Prometheus documentation.
The monitoring exercise would require some data and it is suggested as a prerequisite,
that IDM is set up in a way similar to $OPENIDM/sample/sync-with-ldap or
$OPENIDM/sample/sync-with-csv. This allows you the ability to run a reconciliation against a few users in LDAP or CSV, that will generate some load that can be consumed by Prometheus/Grafana.
that IDM is set up in a way similar to $OPENIDM/sample/sync-with-ldap or
$OPENIDM/sample/sync-with-csv. This allows you the ability to run a reconciliation against a few users in LDAP or CSV, that will generate some load that can be consumed by Prometheus/Grafana.
- On backstage Download the Monitoring Dashboard samples for IDM 6.0.
DM-monitoring-dashboard-samples-6.0.0.zip - Install and download Prometheus and Grafana.
- Now configure IDM6.0 to enable metrics pushed on the metrics endpoint. Edit $OPENIDM/conf/metrics.json and enable the metrics by setting enable to true.
{
"enabled" : true,
"prometheusRole" : "&{openidm.prometheus.role}"
}
- Once turned on you can test and see that you get metrics output on the endpoint with the following curl command.
curl -X GET \
'http://localhost:8080/openidm/metrics/api?_queryFilter=true' \
-H 'content-type: application/json' \
-H 'x-openidm-password: openidm-admin' \
-H 'x-openidm-username: openidm-admin'
Run Load Against IDM Server
To create metrics data on your IDM server, run a reconciliation on your
{project.location} directory. Should you need some data quickly, take a look at
the $OPENIDM/sample/sync-with-ldap sample.
Prometheus Setup
Assuming Prometheus is installed as outlined in the product documentation, configure Prometheus,
to pull metrics from your IDM server.
If you set up a new instance of an IDM server, you could use the following `scrape_configs` settings
in your Prometheus configuration file, `prometheus.yml`:
...
scrape_configs:
# The job name is added as a label `job=<job_name>` to any timeseries
scraped from this config.
- job_name: 'openidm'
scrape_interval: 15s
scrape_timeout: 5s
metrics_path: 'openidm/metrics/prometheus'
# scheme defaults to 'http'.
scheme: http
basic_auth:
username: 'prometheus'
password: 'prometheus'
static_configs:
- targets: ['localhost:8080']
...
Start Prometheus.
./prometheus
Once Prometheus starts, check that Prometheus does retrieve data. The default URL to access
Prometheus is http://localhost:9090.
To troubleshoot any problems, try these steps:
- Check the Prometheus URL on a IDM server to make sure the metrics are published. For example, browse <http://localhost:8080/openidm/metrics/prometheus>, authenticating with username `prometheus` and password `prometheus`.
- Check that the IDM targets are up using the Prometheus targets page. The default URL to browse is <http://localhost:9090/targets>.
- Check that the metrics are found using the Prometheus graph page. The default URL to browse is <http://localhost:9090/graph>. You should find a long list of `idm_*` metrics in the drop-down list.
Grafana Setup
Assuming Grafana is installed according to the details on the Grafana website and you are
on a mac having installed using Brew. Brew is easily installed using the following command:
/usr/bin/ruby -e "$(curl -fsSL https://raw.githubusercontent.com/Homebrew/install/master/install)"
Go ahead and start Grafana.
brew services start grafana
Grafana by default is located on http://localhost:3000. Point your browser there and login
using admin:admin as credentials.
Add a default data source that scrapes data from Prometheus. If you used the default settings,
then use these data source settings:
```
Name: ForgeRockIDM
Type: Prometheus
Default: (checked)
URL: http://localhost:9090
Access: proxy
Auth: Basic Auth (checked)
username: prometheus
password: prometheus
```
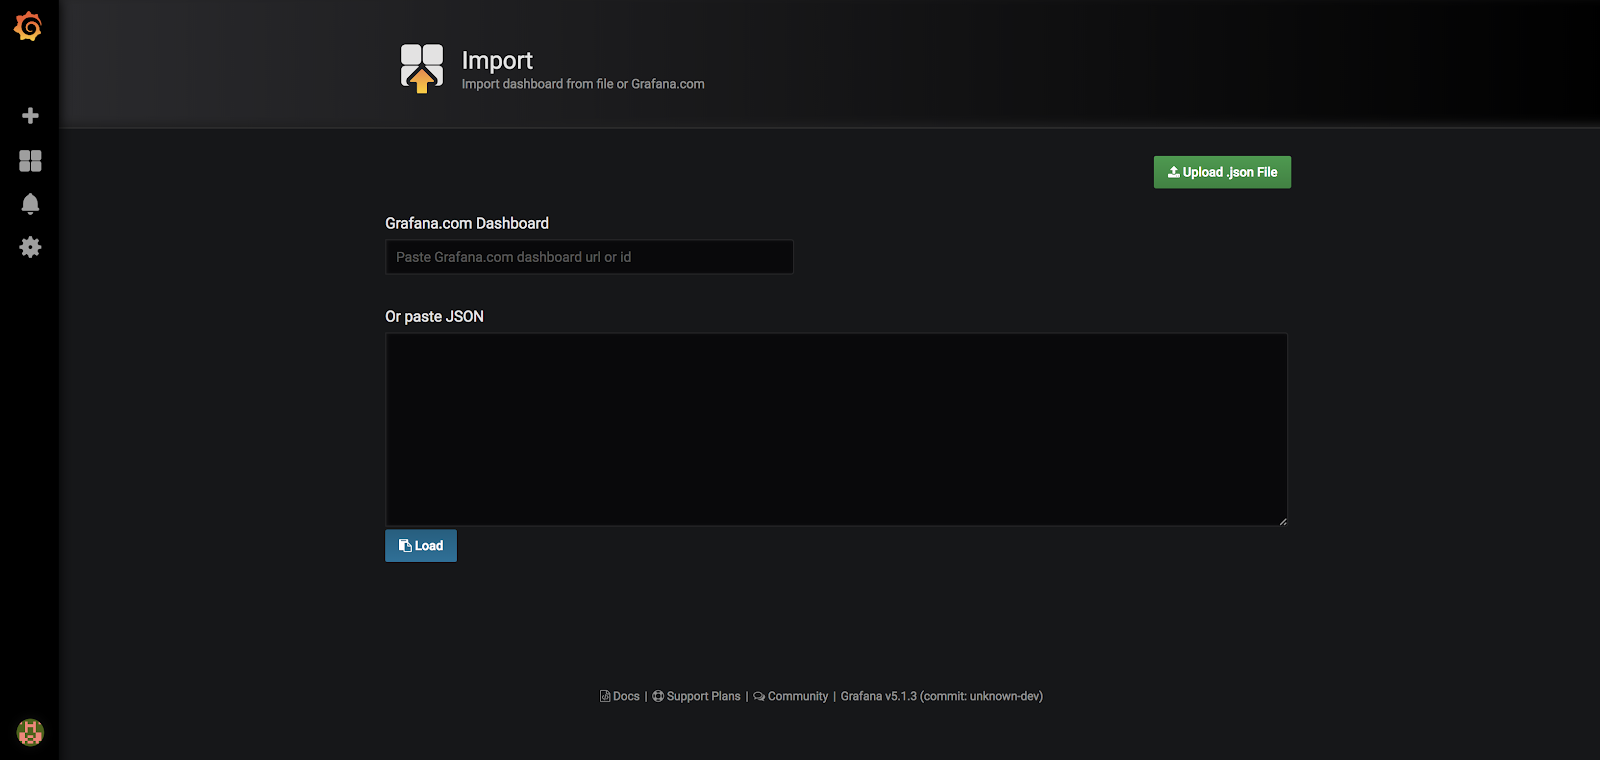
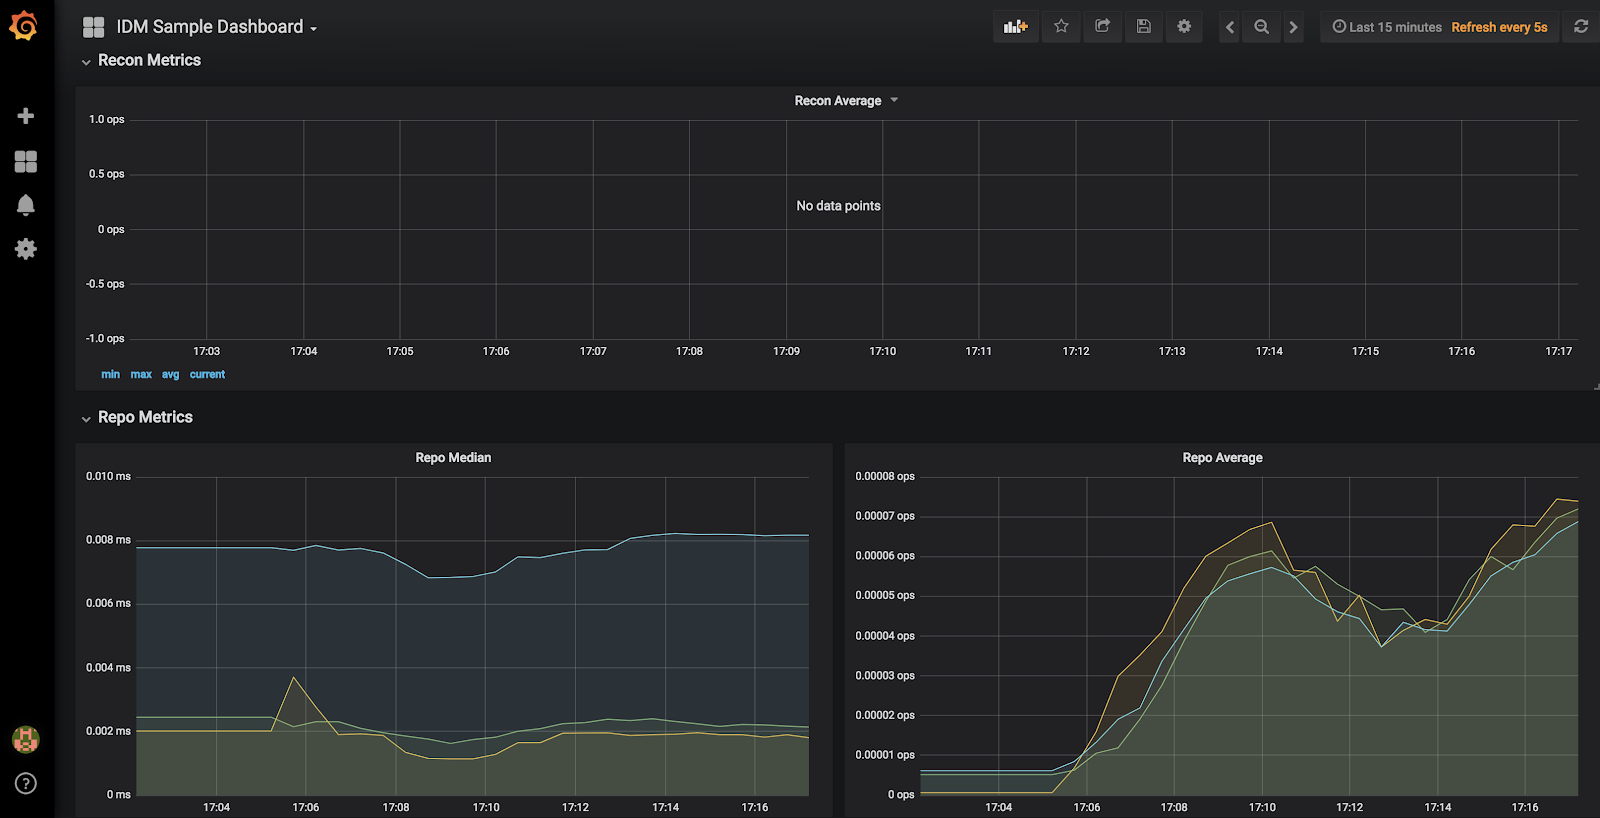
- Import the sample IDM dashboard into Grafana, selecting ForgeRockIDM as the data source.
- (Optional) Generate more load on the IDM server. The dashboard updates the graphs as the data changes.
Inga kommentarer:
Skicka en kommentar